Introduction
A Trace comprises a series of events executed within an LLM chain(workflow). Tracing enables Baserun to capture and display the LLM chain’s entire lifecycle, whether synchronous or asynchronous. Tracing LLM chains allows you to debug your application, monitor your LLM chains’ performance, and also collect user feedback.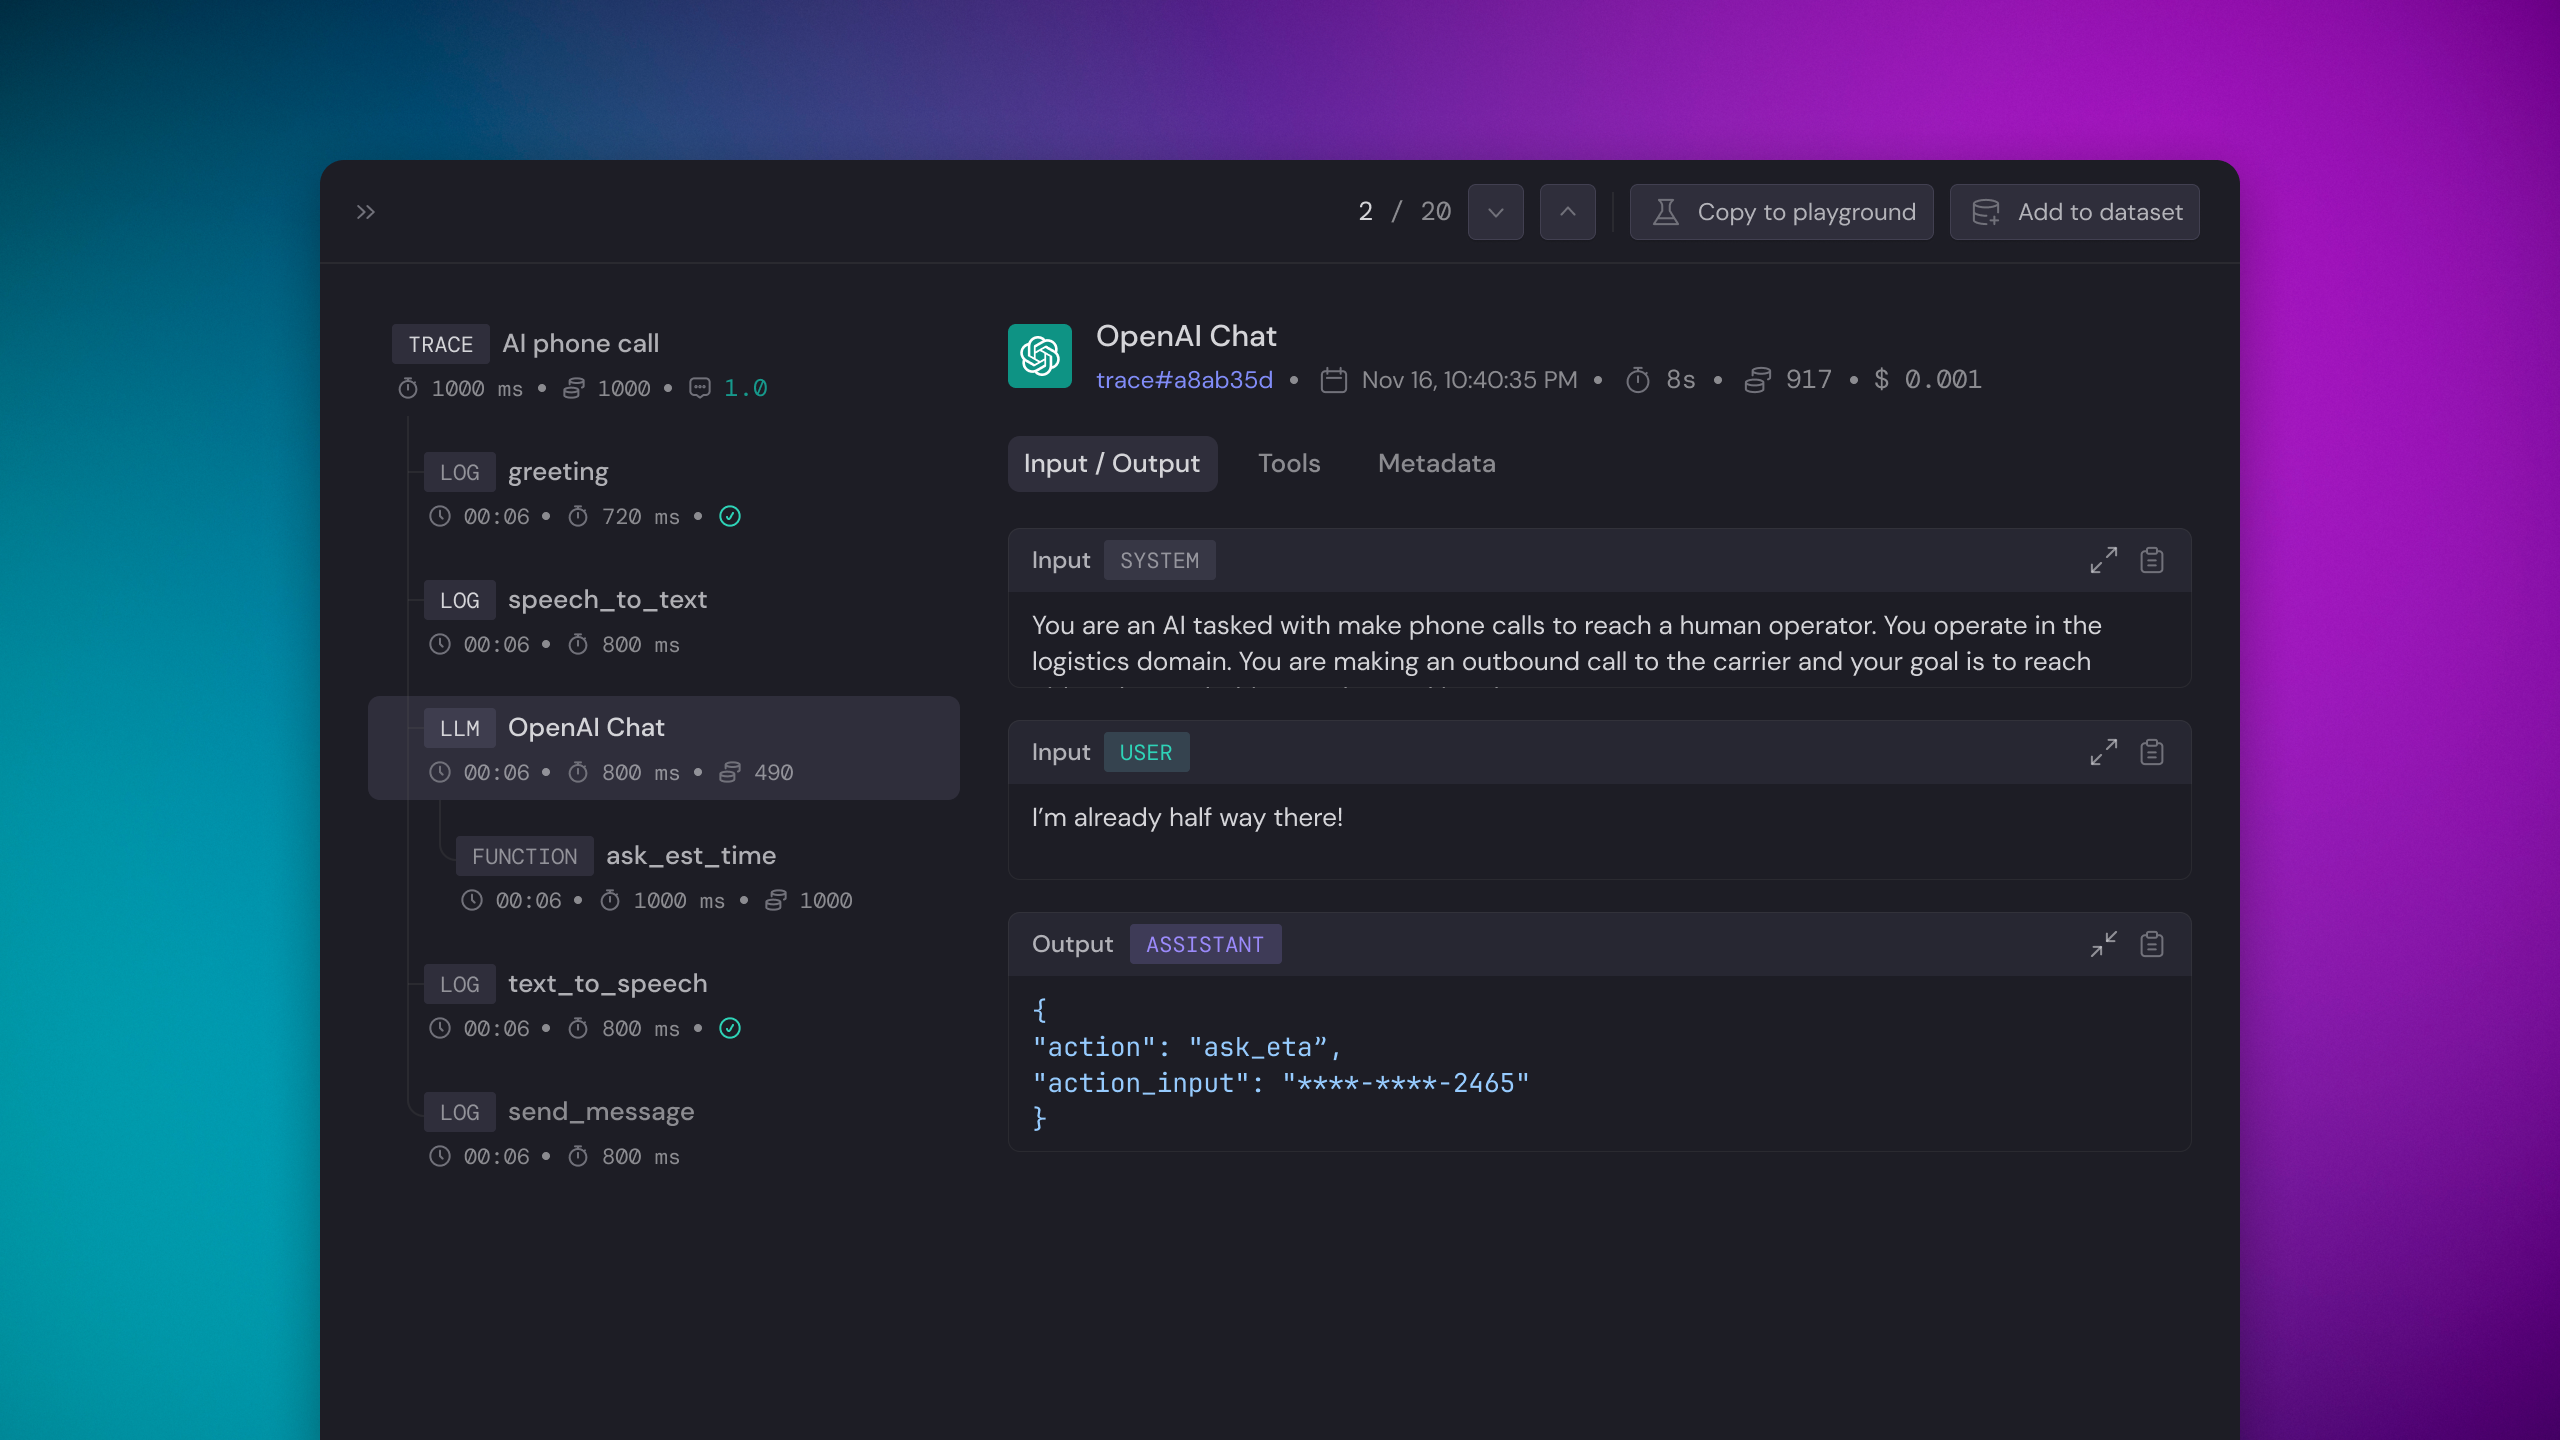
Use cases
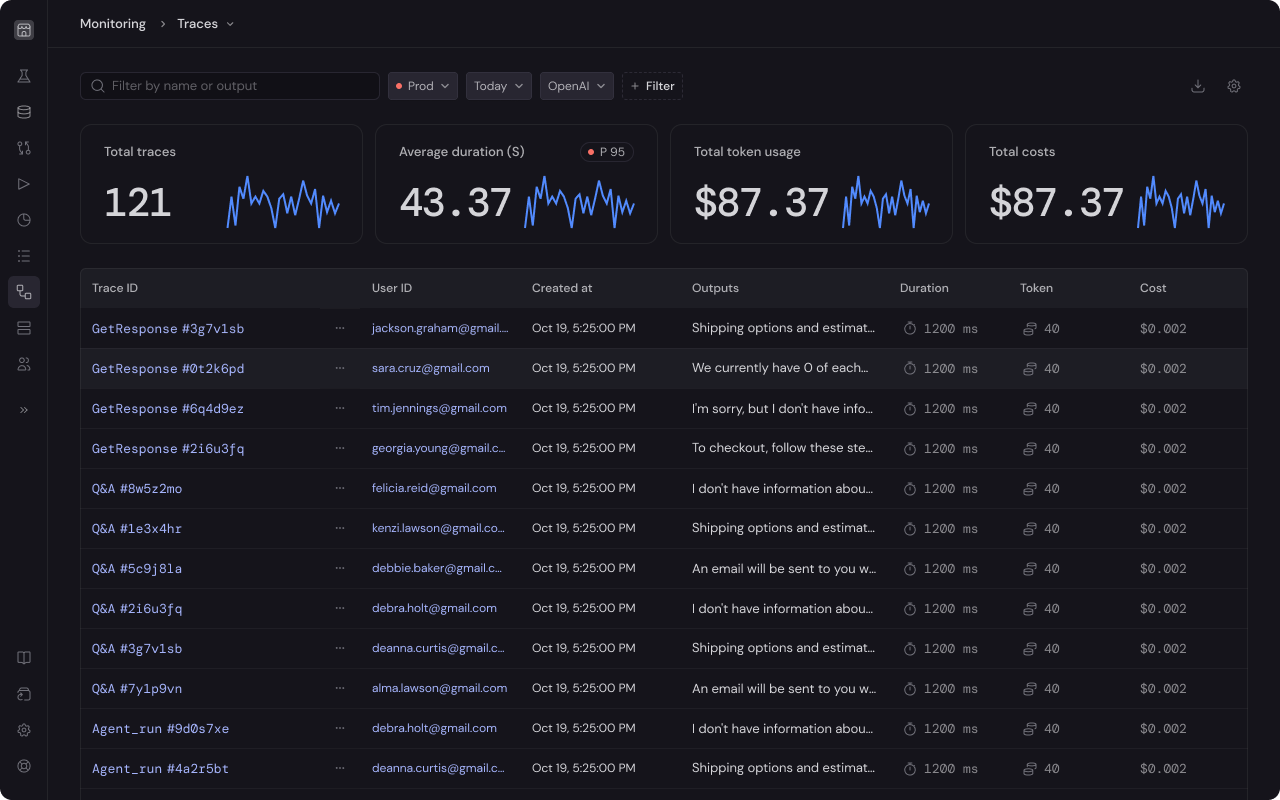
Please reference the Monitoring Overview to learn why logging LLM chain is critical for LLM feature development.Features
- Is model and framework agnostic
- analysis UI to show sequence of events
- Provides token usage, estimated cost, duration, input, and output
- Supports evaluation
- Supports annotation
- Supports user feedback
- Supports async functions
- Option to add custom trace name
- Option to log custom metadata
- Option to set trace result
If you are using Next.js, please reference Monitoring > Tracing with
Next.js.
If you are using Lambda, please reference Monitoring > Tracing with
Lambda.
Instruction
The first 3 steps are the same as the Logging LLM requests tutorial. So, if you have already done this before, jump to step 4.1
Install Baserun SDK
2
Generate an API key
Create an account at https://app.baserun.ai/sign-up. Then generate an API key for your project in the settings tab. Set it as an environment variable:Alternatively set the Baserun API key when initializing the SDK
3
Initialize Baserun
At your application’s startup, define the environment in which you’d like to run Baserun. You can use Baserun in the development environment while iterating on your features, utilizing it for debugging and analysis, or in the production environment to monitor your application.
4
Decide what to trace
The function(s) to trace are ultimately dependent on your app. It could be a main() function, or it could be a handler for an API call.Note for TS/JS: Make sure to always call
await baserun.init() before you instantiate OpenAI, Anthropic or Replicate.Full Example
Demo projects
Python example repo,Typescript example repo If you have any questions or feature requests, join our Discord channel or send us an email at hello@baserun.ai